
We’ve all heard the adage describing the traditional local councillor as “pale, male and middle-aged”. So, just how true is this for the Auckland Council?
Research undertaken at AUT following the 2013 and the recent 2016 local government election compared the gender, ethnicity and age (2013 only) of local candidates and representatives with the gender, ethnicity and age of the Auckland population and highlighted that the local councillor stereotype is beginning to change. Small pockets of ethnic representation are emerging, particularly in Pasifika representation in the south and Asian representation across Auckland. Women elected members now hold 47% of the seats overall, and in 2013, held the majority of leadership positions at the local board level.
At amalgamation, the number of local government elected members representing Auckland decreased from 249 to just 170 – the mayor, 20 councillors and 149 local board members. This means that on average a councillor represents 70,000 Aucklanders, and each local board member more than 9000 Aucklanders. With representation ratios at some of the highest in the western world, who represents us is a critical concern.
International business and public policy literature highlights that greater diversity achieved by the contribution of a wide range of voices at the governance table results in better decision-making in both the public and the private sector.
Gender
We know that in Auckland, as in the rest of New Zealand, females have outnumbered males in the general population since the 1971 census. Females currently make up 52% of the population, however, this has not been reflected in the makeup of our local councils. In 2013, overall, around two thirds of candidates for (65%) for Auckland Council were male, and a third (35%) were female. The election results slightly favoured women, with 42% of the 170 seats held by women. The dominance of male candidates for governing body was greater at 71%, but men were only 65% of elected members. At the local board level 63% of candidates were men, with men making up 58% of elected local board members. Overall, women were more successful at being elected especially at the local board level. Women’s success was accentuated with 12 of the 21 local boards having women chairs and 11 women deputy chairs.

The 2016 local election tells a similar story, although overall women candidates and elected members fared slightly better. Women comprised 39% of all candidates (total 468), yet overall won 47% of the 170 seats. But they comprised less than 30% of governing body candidates, and achieved 35% of the seats. When district health boards and licencing trusts are included, 49% of elected members across Auckland are women.
In three local boards women were the majority of candidates and won between 60-75% of seats:
| % candidates | % seats | no of seats | |
| Great Barrier | 75 | 60 | 3/5 |
| Kaipātiki | 65 | 75 | 3/4 |
| Whau | 38 | 71 | 5/7 |
In a further seven local boards, women won between 50 and 60% of the seats.
This compares favourably with the 2013 results where women candidates were dominant or equal in just 3 local boards, and made up more than 50% of local board members in just six local boards, compared with nine in 2016. In Franklin local board, 64% of candidates were male and won 5 of the 6 seats.
Ethnic representation
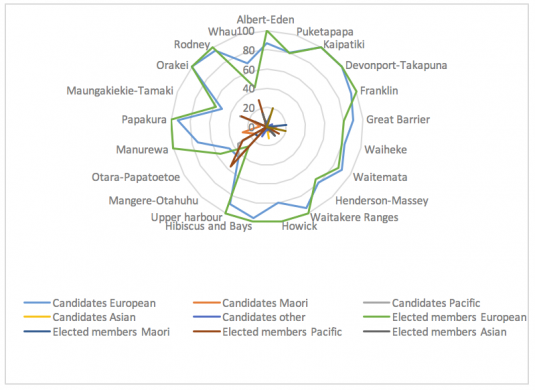
It comes as no surprise that based on the 2013 census data Auckland is the most ethnically diverse city in New Zealand. Nonetheless, in the 2013 Auckland local election an astounding 84% of candidates and 88% of elected members were New Zealand European (NZE), despite only comprising 59% of the population. Māori and Pasifika made up 26% (11% Maori and 15% Pasifika) of the Auckland population, but only 6% of candidates and elected members were Pasifika and with Māori at 5% and 4% respectively. While 23% of the Auckland population identify as Asian, they comprised just 2% of candidates and 1% of elected members.
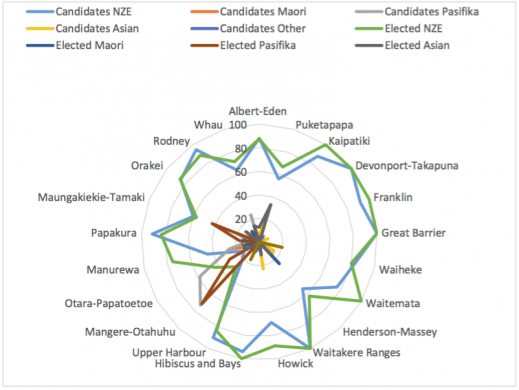
In the 2016 election it was encouraging to see greater ethnic diversity amongst the Auckland local candidates. The figure below highlights that NZE candidates were 71% (down from 84% in 2013). Māori stayed about the same at just over 5%, with Pasifika showing an astounding increase to 13% of candidates, a strong result against their 14% proportion of the Auckland population. Almost 8% of candidates were Asian (a four-fold increase on 2013) and almost 3% of candidates represented other nationalities (including Middle Eastern, Latin American, African and other nationalities).

If we look at the local board level, candidate diversity has increased, with Pasifika candidates risen from 6 to 13% and Asian candidates from 2 to 8% overall. The radar graphs emphasise this increase in non-NZE candidates. The outer perimeters of the graphs show that this election (2016) just seven local boards resulted in 100% NZE elected members compared with 12 in the 2013 election. The increasing Pasifika representation in Manurewa, Ōtara-Papatoetoe and Māngere-Ōtāhuhu local boards is evident.
2013 Ethnicity of local board candidates and elected members
2016 Ethnicity of local board candidates and elected members
Overall, the results show a small increase in ethnic representation evolving in some pockets across Auckland.
Age
An analysis of 2013 candidate and elected member age was undertaken using public sources to ascertain whether councillors and board members were under 45 years of age or over 45 years. The results indicated that 71% of candidates and 69% of elected members were over 45 years, compared with just 36% of the population. Seven candidates were under 25 years, of which two were elected (Devonport-Takapuna and Whau Local Boards).
At the ward level, the skew towards older candidates and elected members was more marked, at 81% and 69% respectively over 45 years. Five local boards were notable for having more than 80% of their members over 45 years (Devonport-Takapuna, Ōrākei, Waiheke, Great Barrier and Waitākere Ranges).
Age data from the 2016 election is not yet available. The high profile mayoral campaign of 22 year-old Chloe Swarbrick, who came in third, and the success of North Shore’s Richard Hills, aged 30, who is the youngest person to win a ward seat in Auckland, show that younger candidates can win votes. Notwithstanding these exceptions, local government in Auckland still appears to be predominantly the preserve of middle aged and older elected members.
How can Auckland Council stay relevant to Auckland’s increasingly diverse communities?
The representation of women at Local Board level is close to matching the Auckland population, but women are under-represented on the governing body. Elected positions across the board were dominated by the over-45s in 2013 and 2016 information is not yet available. There are positive signs that Auckland’s local governance may be starting to reflect in a small way the region’s ethnic population. One obstacle to increasing ethnic diversity is the electoral system used in Auckland: First Past the Post (FPP). We know that FPP disadvantages candidates who are from minority population groups or whose supporters are dispersed across multiple electoral districts. A change to a more proportional electoral system such as Single Transferable Vote (STV) – allowable under the Local Electoral Act 2001 – may result in a Council that more accurately reflects its communities.