
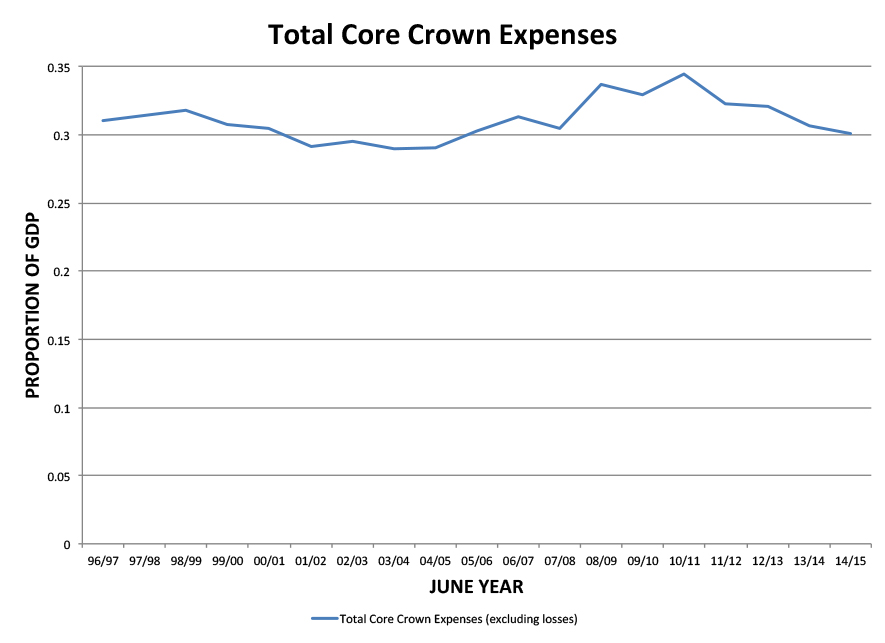
Despite the public’s desire for more government spending there has been little increase in the aggregate level of government spending relative to GDP over the last 20 years. There was a slight rise immediately after the GFC, because GDP stagnated. Government spending as a percent of GDP is now lower that it was at the end of the Bolger and Shipley governments. It is slightly higher in 2014/5 than 10 to 15 years earlier, mainly because of rising spending on New Zealand Superannuation and items such as Kiwisaver and pay-outs under the ETS.
The decision on how much the government is to spend is one for the political process led by the government of the day. Even so, the current government’s decisions seem to contradict the popular preference: the 2014 Election Survey, for example, showed a desire by the participants for measures to reduce income inequality, and an increase in public spending on health, education, housing, law enforcement, public transport and the environment. How has government spending fared over the last (almost) two decades?
Government Spending 1995/6-2014/5
Note that the existing data base ends in 2014/5 but there is (almost) another full year of spending since. That and spending plans announced in the 2016 budget will alter the conclusions, but probably not by much.

Healthcare spending increased from 5.0 percent of GDP in 1996/7 to 6.0 percent 2007/8, rose to 6.4 percent by 2010/11 and the share has since been drifting down to 6.2 percent in the last available (2014/15) year.
We might discount the rise in the early 2010 as a result of government spending not being as restrained as much as the stagnation of production. If we project the trend from 1996/7 to 2007/8, spending on healthcare would have been slightly over 9 percent higher than it was in 2014/15 – say, an extra $1.4 billion.
We might expect spending on healthcare to rise faster than GDP because:
First, an ageing population requires more healthcare. The over-65s consume more healthcare resources than the under 65s (and the over-85s even more so).
Second is the ‘Baumol effect’, where the price of services such as healthcare rises faster than that of other sectors, so that even at constant volumes the value share of services in nominal GDP increases. (The Baumol effect applies to most services which the government provides as well in the private sector.)
Third, as they become more affluent people demand more healthcare. That seems a perfectly reasonably decision; as you get richer do you want more knickknacks or a better quality of life from improved health?
However, these effects do not seem to have been strong enough in recent years to overcome the government’s demand for spending restraint.
New Zealand Superannuation
New Zealand’s universal retirement pension was costing about 5 percent of GDP in 1996/7, fell to 4 percent around 2003/04 and has begun rising again to near 5 percent in 2014/15. The pattern partly reflects the raising of the age of eligibility from 60 to 65 years by 2001 which reduced outlays, some changes in rate of payment relative to wages, and population ageing, with the baby boomers increasingly coming on stream after 2010.
As far as demographers can project, the ageing of the population will continue. Even raising the age of eligibility of the pension to 67, say, will only moderate this effect, not eliminate it in the long run.
(This spending category does not include spending on the retired’s healthcare nor some supplementary transfers that are classified as social security.)
Other Social Security & Welfare
Social security transfers were around 7 percent of GDP in the late 1990s but have been falling since and were nearer 5 percent in 2014/15. They show a temporary upturn at the time of the late 1990s Asian crisis and a longer one at the time of the GFC but, these aside, there is an undoubted downward trend.
It is out of historical character that spending on social security fell under the 1999-2008 Labour-led Government. In part this was due to falling unemployment but more importantly it never restored the benefit cuts which the previous National Government made in 1991, only maintained the real value of benefits, indexing them to prices rather than to, say, wages – in which case beneficiaries would have shared in the prosperity of the era.
Social transfers spend as a proportion of GDP stabilises towards the end of Labour’s last term. This is because it introduced the Working for Families transfer for those with children, but beneficiaries were specifically excluded from it. Entitlement required the recipient to be working at least 20 hours a week and not on the benefit.
Educational Services
Educational Services appear to be modestly rising as a proportion of GDP from 4.8 percent of GDP in 19967/7 to 5.4 percent in 2014/5. There are two complicating effects. One is population shifts which, given the ageing population, suggests that the share should fall. However, like other government services, education is subject to the Baumol effect.
Additionally, there has been a big extension of funding of Early Childhood Education as a greater proportion of children have been involved. Indeed, three-quarters of the increase in share of GDP can be attributed to this subcomponent (from 0.22 percent to 0.68 percent of GDP compared to a total increase in spending of 0.60 percent). The other big gainer is departmental expenses which increases .021 percentage points. The data base does not indicate why this happened.
A second big effect is the write-offs of student loans in 2005/6, 2008/9 and 2010/10, which causes blips in the underlying trends. These all appear to be related to election promises although this may be timing effect. Arguably, tertiary education is not simply an investment for students but also includes an element of distributional entitlement and a public good in the improved capacity for citizenship. Even so, the practice of primary and secondary schools having to charge private fees to parents did not get a similar treatment; schoolchildren do not vote.
Debt Servicing
Debt servicing fell from 3 percent of GDP in 1996/7 to just above 1 percent in 2009/10 as a result of falling relative debt levels and lower interest rates. After which, the level rises reflecting the additional borrowing to smooth New Zealand through the GFC, flattening out because borrowing was eased back and interest rates continued to fall. In 2014/5 it was 1.6 percent of GDP.
Conclusion
In recent years spending in many areas fell or stagnated as a proportion of GDP rather than continuing to rise as they have in the past. This almost certainly reflects a reluctance of the government to raise taxes. There is evidence that the public wants more of these services and transfers. To implement their demands, the public must also accept they will have to pay higher taxes. The designing of a tax regime to meet the needs is not easy. However, the first step must be a clear direction that the public’s wishes should be pursued.
Note: a longer version of this discussion can be found here.