
This Briefing Paper is part of a longer report on housing prices, available on The Policy Observatory website, here.
Historically housing prices in New Zealand have risen a little faster than consumer prices, but the increase has been sharper since 2001, except for the period when the Global Financial Crisis impacted. I have graphed data from the Reserve Bank of New Zealand to see what the relationship is between house price rises and consumer price rises, or general inflation.
Graph I shows the Reserve Bank of New Zealand nominal housing price index (that is, prices not adjusted for inflation) for the 209 quarters from 1964Q2 to 2016Q2. Over the 52 years, the prices rose to over 80 times their initial level, an annual average increase of 8.6 percent per annum; this was faster than inflation.
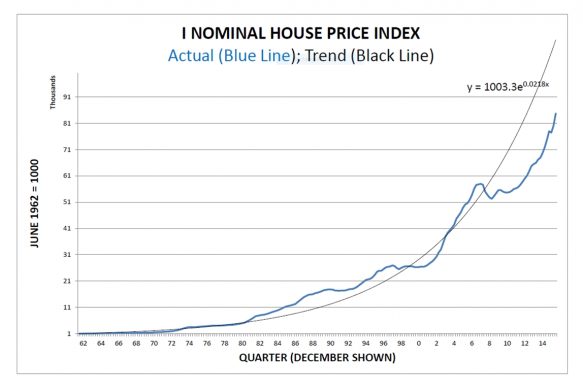
Graph I: The blue line is an index of actual house prices. The black line is the exponential trend line between 1964 and 2001. The growth rate for (nominal) houses prices averaged 9 percent a year.
Note, the linear vertical axis of Graph I does not show growth rates of prices.
Graph II shows the ratio of house prices to consumer prices, which presents a different picture of relative housing inflation.

GRAPH II: The blue line shows house prices relative to consumer prices. Where it rises house price inflation is rising faster than consumer prices. The green line is the trend growth line from 1964 to 2001. It shows that while nominal house prices may not have been rising faster in the 21st century than they had earlier, they were rising faster than consumer prices because the later period was one of much lower consumer inflation.
Up to 2002 the average house price rise was 1.4% p.a. above the rate of inflation. By later standards this rise was small. Aside from measurement error, it might be the consequence of the supply of housing increasing more slowly than the underlying demand. We can speculate why, but any effect was not great.
After 2002 the average annual rise increases markedly to a rate of 8.2% p.a. The slow relative shifts in supply and demand described in the previous paragraph are surely insufficient to explain the quintupling of the relative rate of housing inflation. Moreover, as identified in the 2007 note, the change in the trend housing inflation rate is very abrupt.
Note that there was a five-year period between 2007 and 2012 when house price rises were checked by the Global Financial Crisis. Take this period out and the average increase across the country from 2002 was 12.4% p.a. – almost ten times as high as before 2002. The price increases will vary by region and Auckland’s are among the highest.
The acceleration in the relative premium after 2001 coincides with President George W. Bush increasing the United States’ fiscal deficit which flooded the world with financial liquidity. That made it easier for New Zealand banks to borrow offshore using the cash to fund housing purchases. While the housing price rise was not confined to New Zealand, The Economist reported in 2017 that New Zealand’s house price relative to inflation is the highest in the rich world.
Another source of funds from the international liquidity was investments by migrants or off-shore based investors. Some would have purchased the houses they would live in. But anecdote suggests that some purchasing was for speculation. Probably the source of the funds was capital flight especially from China; instructively Sydney, Melbourne and Vancouver have experienced similar price rises.
The funding inflow generated a speculative bubble, especially as the stock of housing cannot be easily increased. A speculative bubble is typically driven by expectations of strong asset price rises coupled with leveraged borrowing, giving a high return as long as the prices rise. But the price increases cannot sustain the spectators’ expectations forever and eventually the bubble pops or deflates with over-leveraged speculators stranded. Usually there are knock-on impacts which damage those who are innocently (that is, non-speculatively) involved. The lack of an effective capital gains tax in New Zealand has probably compounded the strength of any speculative bubble, especially when speculators could cover part of their purchase price by borrowing at fixed interest below the nominal house price increase.
The boom staggered around the time of the Global Financial Crisis, when international liquidity dried up. It returned when the central banks of the world began quantitative easing, which again injected liquidity into world financial markets. Confidence, expectations and the state of the labour market may also have contributed to this outcome, but may well have been a part of the transmission mechanism from the contraction in international liquidity to the housing market.
The way overseas borrowing works is not straightforward. Suppose I take out a mortgage of $1 million to purchase your house. You deposit the $1 million in the bank so the net position of the bank is unchanged and it can pay off the overseas loan it has used to fund my house purchase. The net position after the transaction appears to be zero.
If this was the entire story, any international borrowing only lubricates the sale and purchase transaction. But in the course of the sale there are transaction costs: real estate agents, banks, lawyers, valuers, surveyors, movers, and so on, while house buyers often go on to commission builders to alter the house and to purchase durables and furnishings. The total costs may be a considerable amount – in one modest case I know of they were in excess of $30,000 including the costs of selling the previous house (a downsizing too). In total this amounts to a considerable expenditure each year (100,000 houses at $30,000 per sales transaction is $3 billion) which is, in effect, borrowed offshore. Observe that it can hardly be argued that this offshore borrowing is funding ‘investment’ – although some is so classified in the official statistics.
If the long-run relativity that existed between 1962 and 2002 had persisted through the following 14 years, house prices today would be half the level they actually are. It could be argued that this is a measure of the degree by which housing is overpriced.