
Introduction
In a recent issue of Policy Quarterly I expressed some surprise over where New Zealanders positioned themselves on a scale between 1, ‘Incomes should be made more equal’ and 10, ‘We need large income differences as incentives for individual effort’. Not only were we less inclined to favour greater equality than similar countries (Australia, Canada, Great Britain) in this international survey but we were also more heterogeneous in our views than most of the other sixteen countries in the comparison.
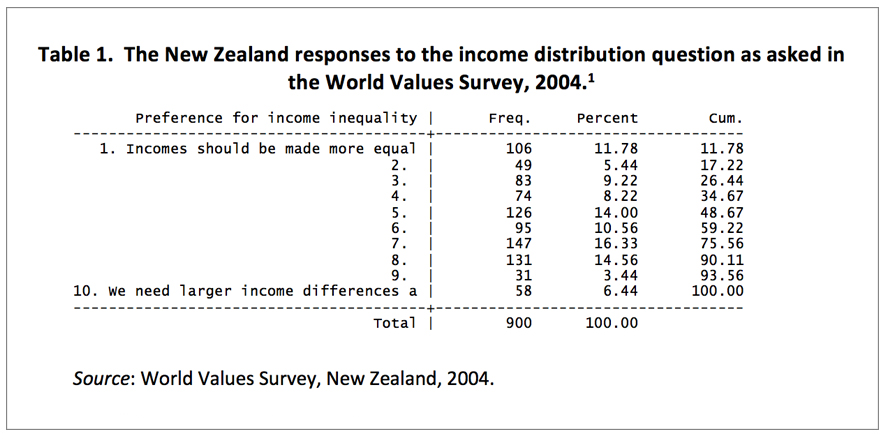
As we see from Table 1, the 900 who responded to the World Values Survey question in 2004 were dispersed across the range of responses to the income distribution question. There was some clustering around the median (6) and at the two extremes (1 and 10). Almost half of the respondents placed themselves between 3 and 7.
In this Briefing Paper I explore possible correlates of this distribution – in particular how age, gender and income affect where people position themselves when asked about income distribution in New Zealand.
Age and (in)equality preferences
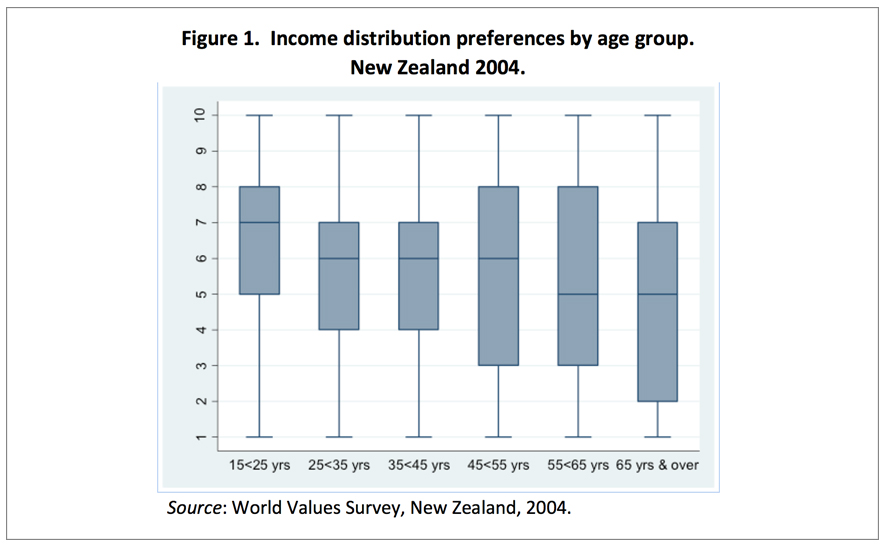
Is it the young, middle or older age groups who most favour (in)equality? An apparent answer lies in the boxplots of Figure 1. The box captures the middle half of the distribution with the horizontal line within the box depicting the median. The medians are highest among the young, they plateau in middle age then fall successively in the older age groups. The young are much more like each other than the older respondents (their boxes are shorter). Like most other indicators, our attitudes towards (in)equality become more diverse as we age.
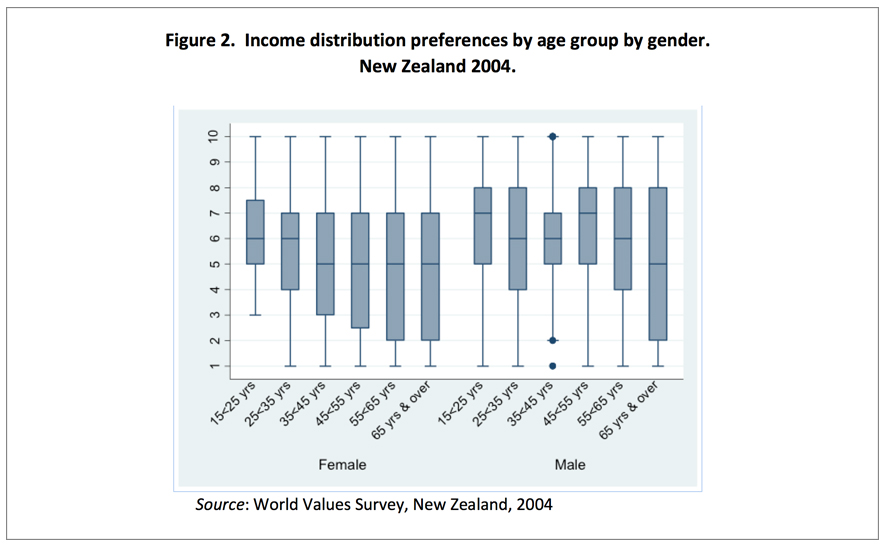
But Figure 1 is also a little misleading. The reason is that it combines the effect of two populations who behave differently when it comes to (in)equality preferences: men and women. As a generalisation, women prefer greater income equality than men; they return a mean of 5.14 on the (in) equality scale compared to 5.84 for men. But that is not the only difference. As Figure 2 shows, women’s median preference for (in)equality decline to a plateau at higher age groups. By contrast, men’s mean preference for (in)equality remains high as they age, until their 50’s, after which their inequality preferences decline with age.
But it is not quite as simple as that, because income also plays a role. Preferences for inequality rise with income among women as well as men. However, while incomes at older age sustain men’s preference for greater inequality, from Figure 3 we see that women actually become more averse to income inequality as they age, regardless of their income group.

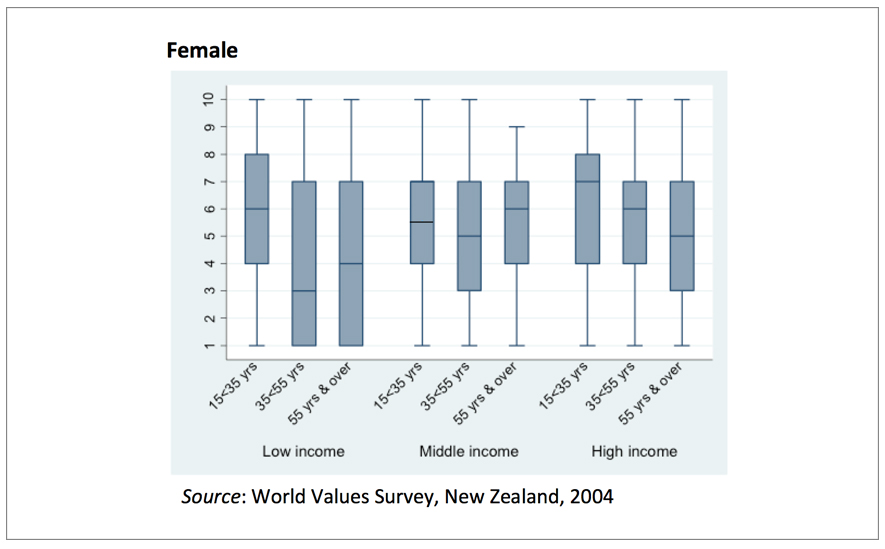
However, perhaps the most surprising result occurs at the other end of the age spectrum, among the young. Not only do the young express unusually high preferences for inequality but it is the young in the lowest income group who most favour inequality, a feature which is equally true of both men and women.
Some interim conclusions
Young people seem to be more comfortable with inequality than older people. However, the story is more complicated than that, particularly when we add income into the mix. The fact that older people value equality more, perhaps because they understand how unstable life can be, is partly counteracted by the fact that they tend to have more income, and people with higher incomes are less concerned about inequality (or are less willing to see greater redistribution). When we include gender however, the picture becomes more complicated still. While income tends to counteract the effects of age among men, women appear to become more concerned about inequality as they age, regardless of income.
The fact that our preference for greater income equality falls with age raises two questions. Is this a cohort effect or an age effect? Does it reflect the much lower levels of inequality experienced by the older age groups when they were young or is it simply that as we age we develop a stronger preference for equality?
The answer to these questions are important both socially and politically. If the negative relationship between equality preferences and age is a cohort effect then its impact will diminish as the generation who grew up during the low inequality era die out. By contrast, if our preference for greater equality rises as we age, regardless of when we were born, then we will see a gradual rise in New Zealander’s preference for income equality as the population as a whole ages.
One way of identifying the presence of cohort effects is to construct synthetic cohorts from the available surveys over the last twenty years but even then the limited time period will be constraining. Even if cohort effects could be discerned we would still have to confront the fact that there is an interaction effect between age, income and gender. None of these interrelationships are likely to be stable over time and therefore predicting the likely distribution of preferences for income equality as the population ages will be challenging.
Finally, I have only considered three likely influences on income distribution preferences: age, income and gender. There are likely to be other personal attributes which play a role, particularly education, which I will consider in due course.
Acknowledgements
I wish to thank Max Rashbrooke and Michael Fletcher for their helpful suggestions on an earlier draft. What remains is my responsibility.
[1] Histograms of income distributions for 1998, 2004 and 2011 may be viewed as Figure 2 in my Policy Quarterly paper.